I wanted to do something like this for a long time, and finally I think it’s at a point where I can release this into the wild.
We’ll take a look at more than 2 million games, taken from the MillionBase PGN database. I ignored any Chess960 games contained, but in total there are 2,197,113 games. I was interested to see what kind of visualizations I can do, and what patterns would be revealed by considering so many games. It was the biggest collection of games I could find, spanning games from 1801 up to 2013, and players with ratings between 215 (wow!) to 2861 (I wonder who that is?). So I think it’s a pretty good representation of chess games all around.
I also wanted to show off some of the software I wrote for this purpose, checkout the last section for links to those.
Meta
Lets start with some general numbers. White wins a bit more often than Black, 39% to 30%, with the rest being draws. It’s not very surprising, although I would have expected the difference to be less. There are also some negligible amount of unfinished games, and I couldn’t discern what happened to those.
This generally seems to agree with all the other statistics out there. Nothing crazy going on here.
Openings
Like many other amateur players, I tend place more importance on openings than I probably should. That being said, I was really excited about seeing the opening tendencies and popular moves. Below is a visualization of the first 5 moves (10-ply) from every game.
Right from the first move, I see that e4 dominates by a large margin (48%), followed by d4 (34%). I would have expected the gap between these two most-popular moves to be smaller, but given the time range of this database, it seems reasonable. I will focus on some of my favorite openings and an insight I found to be quite interesting.
Of course, among e4 openings, the beloved (and my favorite reply as Black) Sicilian (c5) is the most common reply, even more than e5. 2. Nf3 is by far the most played as White, aside from some respectable chunks from Alapin and Closed Sicilian. Interestingly, Black’s second move seems to be a very critical crossroads of how the game will play out.
It’s clear that after Black’s second move, the next couple moves in the opening phase are almost set in stone. I believe this is because the Sicilian has a great deal of opening theory behind it, and people very rarely deviate from mainlines (perhaps because it’s rather sharp, and gets complicated very quickly).
The three big choices are 2.. d6, Nc6 or e6. e6 and Nc6 almost invariably lead to a similar position, but Black chooses to delay his Queen’s Knight’s development for more flexibility in the case of e6 (more on that later).
When 2.. d6 is played, the game almost always follows the pawn exchange line, and ends up in Najdorf (58% of the time!). The Sicilian Dragon (one of my favorite variations in the Sicilian) also gets a respectable 20% chance of occurring.
I knew because of the huge theory behind it, almost all moves in the Sicilian lines are very decisive in how the game will play out, but seeing the critical junctions visually really emphasizes this point.
Other notable openings are Ruy Lopez, with French and Caro-Kann getting a nice chunk. What I found weird was that there were more French games than there were Queen’s Gambit. As a beginner everyone focuses on this classical line, yet it seems a bit under-represented here.
The Indian Defense is the most popular against d4, often resulting in King’s Indian, or Nimzo/Bogo Indian variations.
Regarding uncommon openings, like English (c4) or Reti (Nf3), it’s worth noting that while the main variations are usually followed pretty strictly in other systems, these openings show a lot more variation, and there are less obvious/dominant moves that were followed. If you’re a player that doesn’t like to get into theoretical arguments with your opponent, such openings might be a better fit for you.
Castling
Both colors seem to castle kingside about 80% of the time. What was surprising to me was that Black was more likely to castle queenside, but White was more likely to not castle at all!
Another unexpected result for me was the castling side. I would have expected to see a lot more opposite-side castling, yet it’s at a relatively low 10%, and its almost twice as likely that one side won’t castle. Not sure what to make of this result, but definitely interesting to see.
Endings
I wanted to collect some stats about the game endings, but this little project got a bit out of hand and so I’ll defer the piece-type endings to a later date. I did however get some interesting stats on games ending with check or checkmate. The results aren’t that shocking, but still cute to see.
There are more than 50 thousand games that end in mate! Obviously this is minuscule compared to the size of the database, but I wonder if the players really didn’t see it coming, or just “allowed” their opponent to finish what might have been a nice combination?
Games ending on a check makes me think that either it was a draw-by-perpetual scenario, or that one side had that “Oh shit!” moment, perhaps a double attack by a queen or a knight fork.
Game Length
To get a sense of how long the games took, I plotted them as a simple histogram, number of plies vs number of games.
So, this graph is perhaps too skewed because of some ridiculously long games. The 2 longest games are really long, and I wonder how long the players had to be at the chess board. You can seriously pass out from dehydration!
The longest game, with a whopping 228 moves was played in 2012, and after such an arduous struggle, it ended in a draw. Kinda anti-climactic if you ask me. Guess what the result was for the second longest game, at a measly 227 moves? That was a draw too! So perhaps its wise to not push your luck move after move hoping your opponent will give up and just agree on the draw about 100 moves earlier. Interestingly, the longest game was also one that ended with a check (and also featured my current favorite variation, the Sicilian Accelerated Dragon).
Instead of having a super-skewed graph, I think I can sacrifice 6,474 (0.3%) of the games and focus on the ones with at most 100 moves (or 200-ply).
At first glance my reaction was: “Uh oh, this histogram looks dangerously like a comb distribution”, making me question whether my statistics-gathering was faulty. Although, there isn’t anything that would cause a rounding/collection error. Upon closer look though, you can see that the peaks are higher on odd-numbered plies. This means that Black is more likely to end any given game (whether win, lose or draw). Otherwise, ignoring the peaks, it looks like a good old normal distribution with a mean somewhere around 70-ply.
We shouldn’t ignore the peaks though! And seriously, what’s up with those peaks? The largest peak is on ply 81 (Black’s 40th move), and there is a second peak on ply 120 (White’s 60th move), and a tiny but noticeable peak at ply 160. Hmmm, I wonder if this has anything to do with the classical time controls?
120 minutes for 40 moves, followed by 60 minutes for 20 moves, followed by 15 minutes for the rest of the game, with a 30-second increment starting on move 61
Perhaps it’s a result of players pushing to make the time-control, only to realize they’ve messed up their position? Or straight up running out of time? I think the peaks correspond to the standard time controls too closely to be a coincidence.
Heatmaps
Heatmaps are one of my favorite visualizations to show multiple games on the board. They give insight on what moves occured with frequencies and you get a greater sense of the whole board.
Below is the heatmap visualization, which I hope you’ll take some time to play around. There are 4 categories:
- Square Utilization: the squares that a piece moves to
- Move Squares: squares that a piece moved from
- Capture Squares: squares where a capture occurred
- Checking Squares: squares where the move resulted in a check
Square utilization shows that White tries to be more aggressive and keep its inherent initiative alive. Comparing White Bishops versus Black Bishops, we see White positions them more actively and closer to the center (d3, e3, b5, c4, f4, g5) whereas Black more often prefers more passive but controlling squares (d7, e7, g7) and is more likely to fianchetto his bishops. This might be an interesting artifact of the hypermodern school that had so much impact on Black’s defense.
White Knights are also almost always placed on c3 and f3, but Black Knights, especially the Queen’s Knight likes keeping it flexible and utilize d7 much more than White does for d2.
The Move Squares are mirrored on both sides almost perfectly. I wonder if this says something about how people think when playing with White vs Black pieces.
Bloodiest squares without a doubt are the d4 and d5 squares, boasting over 6 million capturing moves, about 15% more than any other square.
The long range of Bishops are also highlighted in captures, whereas Bishops capture more around the center, the Knights are very much focused on the key central squares.
Rooks come out as being the most versatile in their bloodthirst, their capture squares span a much greater area than any other piece (even the Queens)
Finally, one very unexpected thing for me was that both White Pawns and Black Pawns deliver checks much more on the kingside. I supposed there would be some bias, as the kings prefer castling kingside and then in the endgame support those pawns easier, but its still astonishing to see how much of a bias there is.
Material Count and Exchange Tendencies
We can see the exchange tendencies of players as the game goes on by plotting the average material count. The material on the board is counted using the standard valuations (Pawn: 1, Knight/Bishop: 3, Rook: 5, Queen: 9).
Surprisingly pleasant graph! The decay is definitely quite expected, as the game goes on and pieces get exchanged. The line pretty much settles somewhere around 14, which is about 3-4 pawns + 1 minor piece each.
As for exchange tendencies, we see that after about 30 moves in (60-ply), the material on the board is halved. There is a very nice comparison of exchange tendencies per player on Chess-DB’s Game Statistics page.
Another statistic I was interested in is the average material difference during the game. I wasn’t sure what I was expecting to see, but it’s definitely a nice one.
Wow, what a graph!
Perhaps the best metaphor for a game of chess, the ultimate back and forth between White and Black for control and material dominance. It’s surprisingly balanced all the way up until 120 moves, with White having a slight but probably negligible pull.
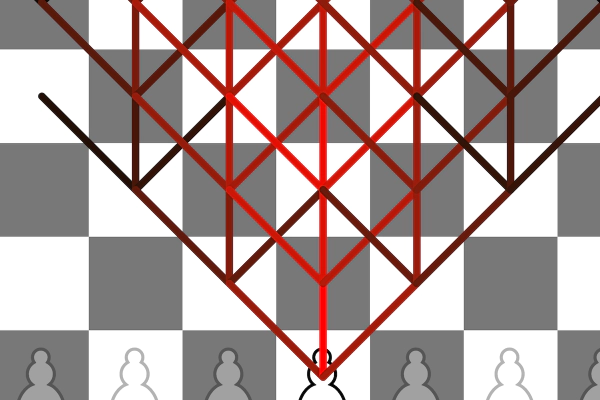
Abstract art
I leave you with a rendition of the pieces journeys throughout the game. I think it looks very pretty. Click on the pieces to explore its moves. Every thin strand of line represents 1,000 moves. Moves that were played less than 1,000 times are not shown.
Closing words
I hope it was pleasant and maybe even useful or instructive to see so many games analyzed visually. Keep in mind this isn’t meant to be a super scientifically rigorous analysis! Let me know of any other interesting patterns or insights you see in the comments.
For more technical details, you might be interested in checking out chess-dataviz for some of the visualizations, it’s quite easy to use. The numbers were gathered by pgnstats, so check that out if you would like to extract such statistics for your own PGN databases.
 Visual Look at 2 Million Chess Games: Part 2
 One Century of Plane Crashes