We’re text mining the transcripts of the TV show LOST, and visualizing them!
I retrieved and parsed the transcripts of LOST from Lostpedia and used a few different tools to look at this data.
One thing to keep in mind is that this analysis is on only the text that the characters speak. I’m not a LOST connoisseur, and haven’t seen all the episodes. I’m not an authority on LOST, or on text mining.
So strap yourselves in for a disgustingly deep dive of this influential TV show, in what I should have titled “I’ve Finally LOST It”.
Meta
Before we get started, you’ll notice that there is a bar with every season of the show given a color. This is the “episode range selector”, which changes the sections of the data you see. Most visualizations that follow below will adjust according to your selection. You can pick specific regions of the data to focus on by brushing it, select a specific Season by clicking on the label, or make no selection (click outside of the selection) to see all the data.
You’ll notice some episodes are way longer than others. These episodes are combined together because some aired as 2-parter, others during the same day back-to-back. The ending episodes of every season, and start of season 6 was combined in the transcripts.
Let’s look at some general metrics first, the chart below shows the total number of words per episode, unique words, and density. Unique words are the count of words that occur at least once. Density is unique/total*100 as a metric to describe what percentage of the text is unique. This tells us about the vocabulary of the show, also called “Vocabulary Density”
S3-E2 is the episode with the highest density, at 28%. The average is somewhere around 23%. There also seems to be a typical slump in word count towards mid-season. Funny enough S1-E1, maybe the most gripping episode for the viewers was also one of the shortest, in terms of word count.
Characters
When I say characters, I mean everything in the text that can have a spoken part. These vary from JACK and DESMOND to AIRPORT ANNOUNCEMENT and THUG #2. The graph below shows how many characters appeared in each episode, the number of stage directions, and the number of scenes. I will expand more on what I considered a “scene” later, but this is just to get a feel for it.
The end of seasons 3 and 5 have way more characters speaking than any other by a large margin, and S6-E14 has only 8 characters that speak in it for the whole episode! Now in one sense, that seems very low, but the next graph shows how much impact even 1 character can have on the whole show.
I find this next graph really interesting, because it shows very obviously how central some characters are to the story. Firstly, there are 676 characters that appear throughout the show’s lifetime. Below is a histogram of characters put in 500-word buckets. So you can see that 593 characters speak between 0-500 words throughout the whole show. These are the THUG #2s and SECOND MANs of the show that set mood or provide information, but their existence is just a plot device.
On the histogram are two cumulative percentage lines, one for number of characters, and one for number of words. This tells us what percentage of these measures we’ve seen so far as we progress up to higher word counts. So, we can see what percentage of characters contribute to what percentage of the words spoken.
One of the important takeaways from the above is that 593 characters (88% of all characters in the show) contribute only 12% to the total words. In other words, almost all characters encountered are trivial ones. If you look at the empty area between 11k-14.5k words, you can see that 99% of the characters contribute about 51% to the total dialogue. This means that only 8 characters contribute a crazy 49% to the writing. Half of the show is literally these 8 characters speaking! These 8 characters are JACK, SAWYER, LOCKE, HURLEY, KATE, SAYID, BEN and CHARLIE.
The above graph shows the “lines” per character, where a line is 1 piece of uninterrupted speech. The impactful 8 characters are seen here at the top, just JACK alone accounts for 10% of all spoken lines. This, I think also corresponds strongly with on-screen time (assuming they speak at about the same speed, not unreasonable). Only in S5 does JACK speak less than anyone, and in other seasons he’s always at the top.
To get a sense of how “popular” these 8 characters were, I tallied up how many scenes they all appear per episode, as well as how many times another character mentions them per episode.
The “spiky” nature of the lines in both appearances and mentions is curious. My impression is that every season had specific episodes that featured 1 character more prominently than others, and the spotlight rotated between them between episodes.
I’m guessing CHARLIE dies after S3, but keeps making reappearances (flash-sideways?) in a few places in S5 and S6. Other characters don’t forget about him though, as he’s mentioned occasionally after his death.
Personalities
So far, all we’ve really done is some statistics on the text, which is cool and all, but I say let’s grab our pickaxes and start some real mining. I had heard of and wanted to use the IBM Watson APIs, especially Personality Insights (2021: now deprecated) and Tone Analyzer to see what they can do for this kind of data.
Given a chunk of text, Watson will generate a “personality profile”. This profile contains the Big-5, Needs, Values and Consumption Preferences.
I wanted to be able to compare random groups/populations together. This next visualisation shows the Big-5, all the individual traits, values and needs. You can pick a single character, or compare multiple and groups of characters. I really hope you take some time to play around with it, I found some comparisons very interesting.
Here are some examples to get you started: men vs women, SUN vs JIN, everyone, KATE, JACK, SAWYER.
Men and women are very close in terms of personality, with minor differences in Openness and Conscientiousness. There is certainly a “gap” between SUN and JIN in terms of their personality. I wonder how this got reflected throughout the series.
Considering “everyone” (top 25 speakers), the average values are of a pretty unique “person”. Very high Agreeableness, low Extraversion, and generally way above or below the sample population of Watson. An interesting point is that characters seem to be very similar in personality traits, I’m not sure if this is because Watson consistently overestimates these values for a TV show text (something it’s probably not fully intended to do) or whether the writing and personalities really do not change that much across the characters, and that really the actors bring any perceived emotion to the light.
I’m still fascinated by what this API can do, but have questioned whether it’s appropriate for works of fiction. I’d love to hear about any other patterns you see, and how much of this really aligns with the show from the fans.
Flashbacks, Flash-forwards and Flash-sideways
LOST is kind of renowned for its liberal use of flashbacks, flash-forwards and the greatest invention of all time to fix plot holes: “flash-sideways”. Below is a visualization of every episode, where any scene that’s a “flash” is colored in. “Scene” in this context refers to the scene in text, and not necessarily the cinematic technique.
Obviously flashbacks were an integral part of S1, and kept going until the end of S3, where the flash-forwards started cropping up. S5 has the least “flashes” and S6 is full of flash-sideways(es?).
Tone
The other Watson API, Tone Analyzer, makes an attempt at determining the “tone” of a piece of text. This is also often referred to as “sentiment analysis” in some circles, but Tone Analyzer determines 4 emotional tones, and 3 language tones.
The graph below shows the tones detected in each scene. Color-coded segments show that the tone was detected, while the opacity indicates the confidence of the tone being present. You can show/hide specific tones by clicking on the legend, so I hope you take some time to play around.
Looking at emotion tones, Joy and Sadness are the big duo, very prominent throughout. One thing I noticed about Fear is that it generally occurs mid-to-late episode. S4-E5 has no Fear in it!
It’s kind of interesting to see that the majority of the writing shows tentative tone. There are some “Analytical” sections sprinkled throughout, and even less amounts of “Confident”, but “Tentative” definitely dominates the show. It also kind of makes sense, since mysteries and “what ifs” really are a cornerstone of the show.
Co-occurrence
Looking at the connections between characters is perhaps best illustrated by a force-directed graph. The radius of the circles scale with the number of different connections a character has, and the closeness indicates the number of times two characters connect. In this case, we are looking at how many scenes two characters appear together. This means that characters with bigger radii appear more with different people, and those that appear together often are placed closer together.
Play around with the episode selector. It’s a bit slow, but you’ll be ok. Click on the characters to highlight only their connections.
Honestly to me this is more of a vanity visualization, nevertheless there are some cool things to see. The loneliest duo is WIFE and RECORD in all the show, appearing completely isolated from any other characters, followed by YOUNG SAWYER, SAWYER'S FATHER and MARY. I’m guessing these scenes probably were isolated flashbacks. In S2 there’s the funny “pentagram of evil” on the right, with THUG CAPTAIN, THUG, THUG #2, PRIEST and YOUNG EKO.
Reading Level
Reading level is something I often wondered about TV shows. My gut feeling was that it’d be somewhat low, to appeal to a bigger and wider demographic. textstat is a tool that runs text through a few “reading level” measurements, and reports back a value that corresponds to the school grade level of the text. Below are the results of running textstat on the text of every episode.
Most speech in the show is 2nd grade level, particularly S2, otherwise there are pretty frequent episodes with 5th grade level. S5-E1 is the most complex text with 8th grade level. This makes me think that the dialogue between characters are often short, practical and concrete, without much philosophizing or elaborate language.
We can also see the reading level per character. I wanted to see if there was variation between characters in terms of reading level. Below is the reading level of the top 25 characters.
FARADAY is the most complex speaker, with 7th grade level. Most of the heavy hitters, the big 8 if you will, have 3rd grade reading level which I’m thinking brings the episode averages down because they speak way more than other characters. I wonder if differences like this was apparent on the TV show, particularly JACK (6th grade) vs SAWYER or KATE (3rd grade).
Word Connections
I saved the prettiest for last! I saw this visualization for “Les Miserables” by Neoformix and had to try to adapt it for LOST. You can get a sense of how prominent and often a word was used throughout the series. I picked a couple of word groups, colored individually. Click on words to toggle them on or off, and use arrow buttons to cycle through groups of words.
That’s it, if you’ve made it this far, I thank you for reading along. Hope this was entertaining and a bit informative. I love hearing any patterns you find, observations or feedback, so please let me know in the comments.
Similar Reading
If you can’t get enough, below is a list of similar analyses that you might like, which this post was heavily inspired from.
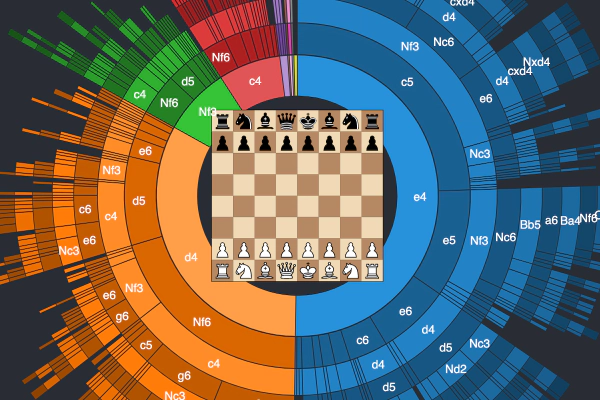 A Visual Look at 2 Million Chess Games
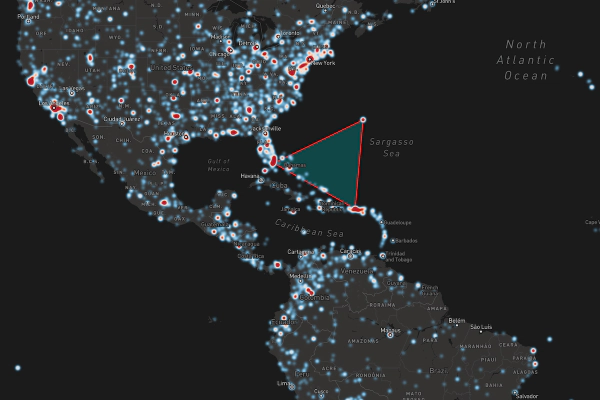 One Century of Plane Crashes