2022 Chess Candidates Tournament Recap

thumbnail image for 2022 Chess Candidates Tournament Recap
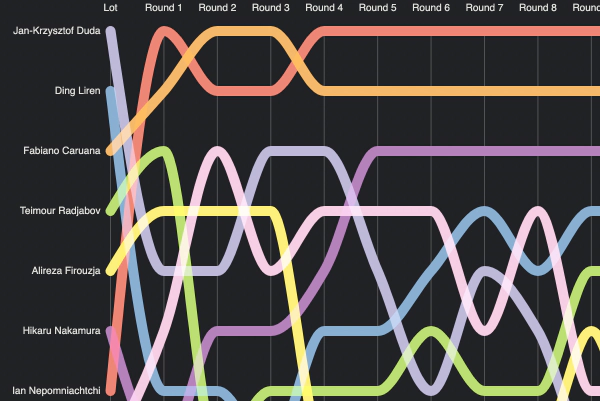
I wanted to do a quick recap of the 2022 Chess Candidates Tournament that saw Ian Nepomniachtchi emerge as the challenger for the second time. There were some good findings in there! Click on the graphic to see it in full size. .viz { margin: 1rem auto; display: block; } img { width: 100%; }

Beholder: Beauty in the eyes of Playboy

thumbnail image for Beholder: Beauty in the eyes of Playboy
We’re looking at some risque data this time! I wanted to do something offbeat, but not quite Last Words in Texas-level soul crushing. So, I gathered some data on Playboy’s Playmates of the Month. Playboy stopped picking the Playmate of the Month starting in 2021, and the 66 year saga came to an end. More, the physical magazine itself was discontinued in late 2020. There’s a rich history behind Playboy, the taboo element, sexiness and beauty.

Last Words in Texas

thumbnail image for Last Words in Texas
In July of 1976, the US Supreme Court set forth the framework that states must follow to comply with the ban on cruel and unusual punishment in the Eighth Amendment with the Gregg v. Georgia decision. Since then, 1532 people were executed in the United States. Death penalty and executions are subject to local laws and not every state carries them out to the same extent (map). Texas carries out the majority of these executions, having executed more people than the next top 6 states combined.

ca·coph·o·ny - a harsh discordant mixture of sounds.

thumbnail image for ca·coph·o·ny - a harsh discordant mixture of sounds.
I always get glimpses of cool ideas when I see great data, and after watching parts of the First Presidential Debate of 2020 I knew I had to do something with it. The transcript over at Rev.com contains incredibly detailed and millisecond timestamped data. Hearing about how chaotic the debate went (and witnessing it after digging into the data), I wanted to look at how often people spoke over each other.

Color in Books

thumbnail image for Color in Books
Project Gutenberg is an amazing source of books that are in the public domain. An avid reader myself, I wanted to make a creative visualization using the text of the great books when I came across the “Best Books Ever” list. Click on the graphic to see it in full size. I hope this inspires you to read one of these classics! Interested in prints of this graphic? I have a few copies printed on beautiful art paper.

One Century of Plane Crashes

thumbnail image for One Century of Plane Crashes
An exploration of 100 years of plane crashes. I discovered the ASN Aviation Safety Database some time ago, and knew almost instantly that I would have to dig deep on this one. The earliest crash is from August 2nd, 1919 and the latest record I have is from August 1st, 2019. There are approximately 22 thousand crash records. Planes and aviation represent a great chunk of our progress in technology and manufacturing, as well as bringing the world closer to us, with novel means of not just travel, but other endeavors like war and scientific research.

Visual Look at 2 Million Chess Games: Part 2

thumbnail image for Visual Look at 2 Million Chess Games: Part 2
We’re looking deeper into the amazing MillionBase database with over two million chess games to see what else we can learn about the data specifically, and possibly about chess in general. I have analyzed some of this data in Part 1. If you haven’t seen that, feel free to give it a read. This post will focus on other aspects of the data, and I have drawn from some reader suggestions from the previous post.

One Year in Vancouver: Visualizing Events

thumbnail image for One Year in Vancouver: Visualizing Events
We’re looking at the year of 2018 in Vancouver through the lens of event listings on the Georgia Straight Events page. I find their list extremely useful and use it all the time to find cool things to do, and notice a great deal of events happening all over the city. I collected all the events over the course of 2018 and wanted to make a “map of the city” from this data.

Text Mining LOST

thumbnail image for Text Mining LOST
We’re text mining the transcripts of the TV show LOST, and visualizing them! I retrieved and parsed the transcripts of LOST from Lostpedia and used a few different tools to look at this data. One thing to keep in mind is that this analysis is on only the text that the characters speak. I’m not a LOST connoisseur, and haven’t seen all the episodes. I’m not an authority on LOST, or on text mining.

A Visual Look at 2 Million Chess Games

thumbnail image for A Visual Look at 2 Million Chess Games
I wanted to do something like this for a long time, and finally I think it’s at a point where I can release this into the wild. We’ll take a look at more than 2 million games, taken from the MillionBase PGN database. I ignored any Chess960 games contained, but in total there are 2,197,113 games. I was interested to see what kind of visualizations I can do, and what patterns would be revealed by considering so many games.