We’re looking deeper into the amazing MillionBase database with over two million chess games to see what else we can learn about the data specifically, and possibly about chess in general. I have analyzed some of this data in Part 1. If you haven’t seen that, feel free to give it a read.
This post will focus on other aspects of the data, and I have drawn from some reader suggestions from the previous post. Since publishing that, I received so many great reader suggestions and requests. It was incredible to see such engagement and to reflect on the questions readers posed in Part 1.
Let’s get started!
Branching Factor
Tobias Voelk: Hey, could you add another statistic: The distribution of the number of moves from a position. I know the average is roughly around 35-40, but what does the distribution look like? Is it a Gauss curve?
Kai Middleton: Another idea: I’d like to see the average branching factor at move n.
Great idea and observations, let’s see. “Branching Factor” in this context refers to the total number of legal moves from a given position, averaged across all the games.
Not really a Gauss curve! It’s notable that white almost always has a higher branching factor than black. In other words, white has more moves available than black at any given moment, on average. Whether these extra 1-4 legal moves make any practical difference is debatable in my opinion.
Material when game ends
mike: I think it would be interesting to see whats the difference in material when the game end in relation to the total played moves.
I agree, so let’s look at both the total count of material at the end of a game as well as the material difference.
Material Count
Not surprisingly, material count at the end of a game is very similar to the average count graph from Part 1.
Material Difference
The difference in material grows the longer the game takes to finish. This can indicate that smaller advantages in material can play an important role earlier in the game (in terms of the opponent resigning). As the game gets longer, the “tolerance” for material difference increases. Perhaps a passed pawn giving the other side some hope? Or it could be a positional disadvantage that keeps counterplay alive as the side with greater difference tries to re-coordinate their pieces.
More Heatmaps
Warren Smith: Make heat maps for promotion squares to RBNQ and en passant capture squares. Make checkmate-square and stalemate-square heat maps. A more sophisticated programming project would be to compute checkmating “patterns” and display all the most frequent ones.
Totally agree with these ideas, so here we go! Starting off with some simpler ones first.
Checkmate squares
Squares where a checkmate is delivered. G file, especially g1 and g8 jump out. Expected, as kingside castling is more common than anything else.
Stalemate squares
Squares where the king is stalemated. I did not expect this, but it seems 3rd rank (ranks 3 and 6) are more common. This might synergize with the pawn structures that occur in the endgame, which sadly this visualization does not show.
Last move of checkmate game
Squares where a piece delivered checkmate. Queens are winners in this, but it’s super cool to see some King checkmates, where a King moves (or castles) and creates a discovered checkmate.
Rooks are focused almost exclusively on the edges of the board, such as back rank mates. Pawn checkmates are interesting to see, and mostly happen on the kingside. This is consistent with Pawns delivering more checks on the kingside from Part 1.
En-passant squares
Squares where an en-passant capture occured. White captures en-passant about 35% more than black, mostly on d3 and e3 squares.
Promotion squares
Promotion squares, and the pieces the pawns got promoted to. There seems to be some bias towards the queenside. This makes sense as people castle kingside more and that would make it harder to chase down pawns on the queenside.
First blood
Squares of the first capture of a game. First exchange is generally made by a Pawn, but Bishop captures are also somewhat common.
Not many other different insights from Part 1, but it’s weird that if a Rook makes the first capture of a game, it’s usually on b6. Not sure if this is some thematic thing in a popular opening? Seeing King captures on f2 reminds me of beginner sacrifices on f2 that usually trap only the most novice players.
Ratings Distribution
Histogram of the ratings of players in buckets of 100. This gives a sense of the strength of players in this database.
Years Distribution
Histogram of the years of games.
Pawn paths
zvranic: Also, I would really like to see abstract art for pawns which does not include journeys after promotion. It would be really interesting to see which pawns get promoted most and how far side-wise can they go. Thanks!
This one was requested a few times, in retrospect showing paths of pieces after promotion took away from the pawns’ journeys. Instead of using the same visualization with the pawn data, I tried something different. I think it highlights the “how far sideways can a pawn go” better.
Seems like the farthest sideways travel was 5 squares. Interestingly all B and C file pawns (b2, b7, c2, c7) at some point went 5 squares, but their counterparts on F and G did not.
Imbalances
mark: I’d also like to see the Opening map cross-referenced with wins but negative material. Perhaps you could even discover wins-by-sacrifice looking for a major material change and a win?
Chessplayer: This is cool! I would love to see a graph of the exchange versus the result of the game.
These are at best tangentinally related to the visualizations below, but I wanted to focus on the imbalances of the game with respect to how often a side wins. The imbalances are denoted by (Piece)v(Piece) such as PvP, PPv, NvR etc. They are computed separately for both white and black, so NvP doesn’t mean white has N and black has P, it is relative to the color. In other words, NvPP graphs show when White has NvPP, and also when Black has NvPP.
Pawn Advantage
When a side is up 1, 2 or 3 pawns. 1 pawn advantage is pretty good, whereas 2 pawns is a confident win. Interestingly, the chance of conversion does not change as much for 3 pawns as it does for 2 pawns advantage.
Piece Advantage
When one side is a piece up. Not surprisingly being a piece down is rarely recoverable.
Knight Advantage
Investigating how strong a Knight is against 1-4 pawns.
Bishop Advantage
Investigating how strong a Bishop is against 1-4 pawns. Some parallels with Knights here.
Minor Piece Imbalances
Imbalances between minor pieces and other pieces.
Exchange Advantage
Game result when a side has the exchange advantage, and a Rook versus three Pawns.
2 Minors for Rook
2 minor pieces for a rook seems to be a very solid advantage.
Major Piece Imbalances
Imbalance between Queen and Rooks.
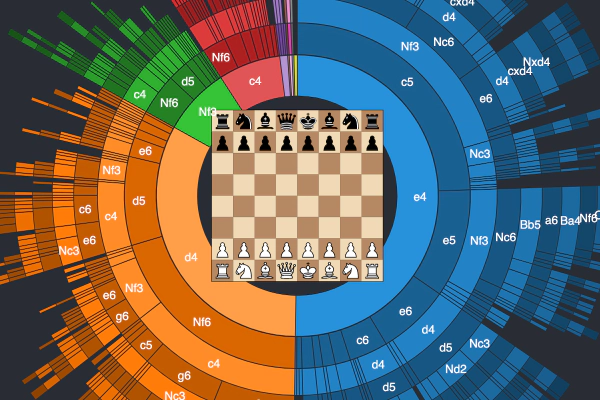
Positions
Most common positions in the database, overall, after 6 full moves and after 12 full moves. The reason there are repeated openings are because this is based on FEN strings. Charting the actual openings aren’t very interesting, as there are already many resources that describe them.
Closing Words
I hope this gave you some ideas of your own to explore. I would love to hear your thoughts and questions. I want to explore this database more and am considering focusing on a particular player or an event. In the future I want to explore pawn moves or look at different possibilities with engine analysis. I’m eager to hear what you think!
 A Visual Look at 2 Million Chess Games
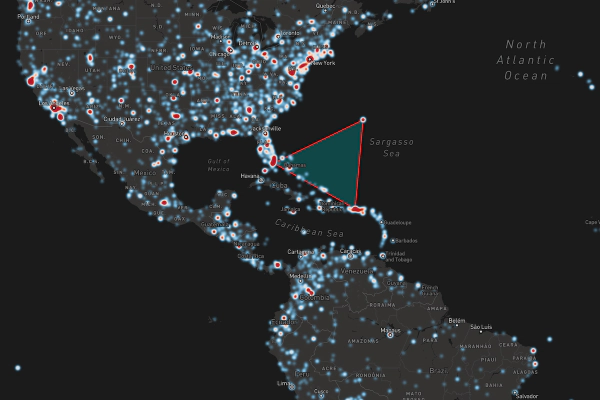 One Century of Plane Crashes